When you’re monitoring, you’re gathering and analyzing information. Business software performance, resource uptime, and health can all be assessed with this information.
An efficient tracking strategy reveals insights into the inner workings of your application’s components. As an added bonus, you get more availability thanks to the early warnings of potential problems that monitoring provides. Problems can be fixed before they escalate.
The Essentials of Azure Monitoring
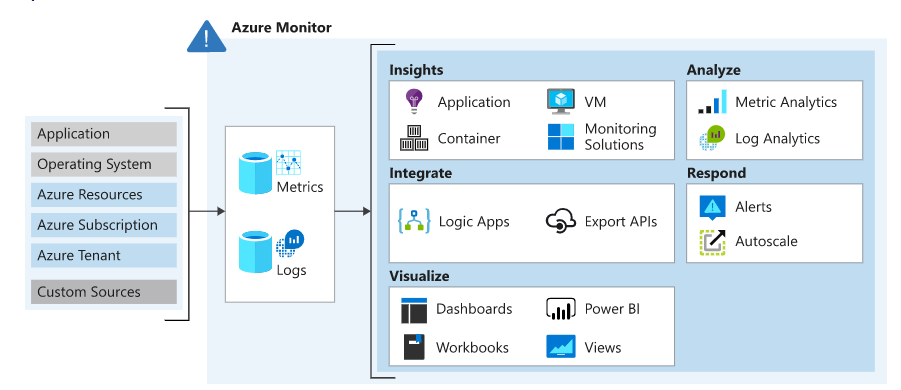
Metrics are numerical values that define a system’s current state. Metrics enable near-real-time scenarios and are lightweight. For example, a metric alert can notify you when CPU usage is greater than 95 percent.
Logs store various types of data in records with unique qualities. Logs hold events, traces, and performance data for analysis. For example, a log alert can notify you when a web server has returned a number of 404 or 500 responses.
Activity log alerts notify you when Azure resources change state. For example, an activity log alert can notify you when a resource is deleted.
Metrics and logs are stored in Azure Monitor’s data stores.
- Application data: Data that relates to your custom application code.
- Operating system data: Data from the Windows or Linux virtual machines that host your application.
- Azure resource data: Data that relates to the operations of an Azure resource, such as a web app or a load balancer.
- Azure subscription data: Data that relates to your subscription. It includes data about Azure health and availability.
- Azure tenant data: Data about your Azure organization-level services, such as Azure Active Directory.
- Get insights: To use the APM tools, you’ll need to install the Azure Application Insights plugin for Azure Monitor. Tools for application performance monitoring (APM) can be used to track down useful information like trail logs. There are a wide variety of Azure services that can be used with Application Insights, including Azure Virtual Machines and Azure Virtual Machine Scale Sets, Azure Container Instances, Azure Cosmos Database, and Azure IoT Edge.
- Visualize: Use Azure Monitor to view and analyze your metrics and logs. Azure Monitor’s Azure Workbooks feature lets you use Power BI for customizable dashboards and views.
- Analyze: Get your data log searches written in the Azure portal with the help of Azure Monitor Logs (Log Analytics). You can use Azure Monitor Metrics and its robust analysis engine to conduct live analyses of your log data.
- Respond: Apply log alert criteria in Azure Monitor to get real-time updates on your app’s health. By setting up triggers in the service, you can have it do something automatically when certain criteria are met in your queries and alerts.
- Integrate: Log query results from Azure CLI, Azure PowerShell cmdlets, and APIs. Export log info to Azure Storage or Event Hubs automatically. Using Azure Logic Apps, obtain and copy log data.
Monitoring Data tiers
Azure Monitor can gather info from various sources. The collected info is categorized by tier.
| Data tier | Description |
|---|---|
| Application | The Application tier contains monitoring data about the performance and functionality of your application code. This data is collected regardless of your platform. |
| Guest OS | Monitoring data about the operating system on which your application is running is organized into the Guest OS tier. Your application can run in Azure, another cloud, or on-premises. |
| Azure resource | The Azure resource tier holds monitoring data about the operation of any Azure resource you utilize, including consumption details for the resource. |
| Azure subscription | The Azure subscription tier contains monitoring data about the operation and management of your Azure subscription. The tier also contains data about the health and operation of Azure itself. |
| Azure tenant | Data about the operation of your tenant-level Azure services, such as Azure Active Directory, is organized into the Azure tenant tier. |
Event Categories
Azure Monitor activity logs so you can view specific information
| Event Category | Event data | Examples |
|---|---|---|
| Administrative | All create, update, delete, and action operations performed through Azure Resource Manager and any changes to role-based access control (RBAC) in your filtered subscriptions | create virtual machine delete a network security group |
| Service Health | All service health events for Azure services and resources connected with your filtered subscriptions, including Action Required, Assisted Recovery, Incident, Maintenance, Information, or Security | SQL Azure in East US is experiencing downtime Azure SQL Data Warehouse Scheduled Maintenance Complete |
| Resource Health | All resource health events for your filtered Azure resources, including Available, Unavailable, Degraded, or Unknown, and identified as Platform Initiated or User Initiate | Virtual Machine health status changed to unavailable Web App health status changed to available |
| Alert | All activations of Azure alerts for your filtered subscriptions and resources | CPU % on devVM001 has been over 80 for the past 5 minutes Disk read LessThan 100000 in the last 5 minutes |
| Autoscale | All events related to the operation of the autoscale engine based on any autoscale settings defined for your filtered subscriptions | Autoscale scale-up action failed |
| Recommendation | Recommendation events for certain Azure resource types, such as websites and SQL servers, based on your filtered subscriptions and resources | Recommendations for how to better utilize your resources |
| Security | All alerts generated by Microsoft Defender for Cloud affecting your filtered subscriptions and resources | A suspicious double extension file executed |
| Policy | All effect action operations are performed by Azure Policy for your filtered subscriptions and resources, where every action taken by Azure Policy is modeled as an operation on a resource | Audit and Deny |
Azure Monitor alerts
Azure Administrators receive alerts for monitored apps and resources using Azure Monitor. Alerts and automated responses can help a company address system issues quickly.
Telemetry data can trigger Azure alerts and messages. Azure alerts detect and resolve issues to keep your applications running and avoid user service disruptions.
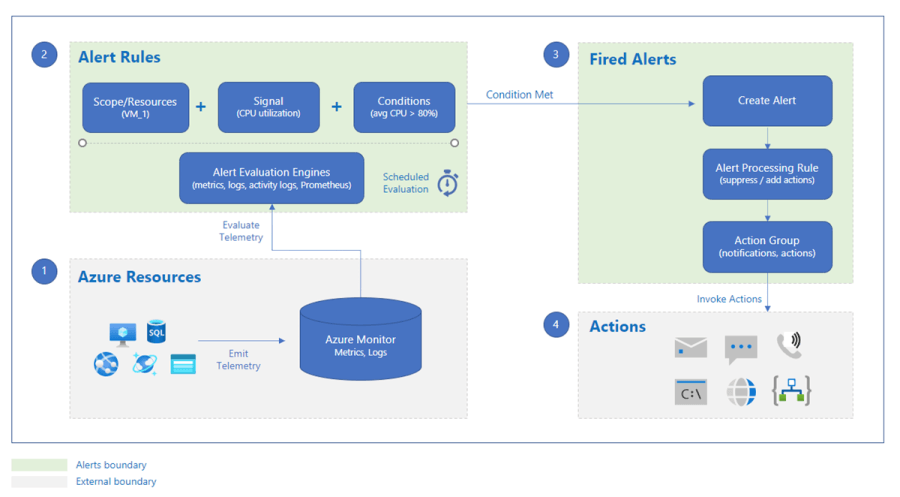
Most alerts fall into one of these categories.
- Metric alerts: Regularly assess resource metrics. Your platform, Azure Monitor logs turned to metrics, Azure Application Insights, and custom metrics. Metric alerts have numerous conditions and dynamic thresholds.
- Log alerts: You can analyze resource logs at regular intervals using Log Analytics queries in the Azure portal.
- Activity log events: Set up alerts to notify you of new activity log events that fit your criteria. Activity log alerts can be Resource Health or Service Health.
- Smart detection alerts: By employing intelligent detection on your Application Insights resources, you will be provided with automated warnings regarding possible speed issues and failure anomalies in your web applications. If you’re using Application Insights, you can migrate to smart detection and then set up alert rules for the various smart detection components.
New, Acknowledged & Closed – Alert State
Stateless and stateful alerts
Stateless alerts trigger each time your alert rule condition matches your data, even if the same alert already exists. You can configure log alerts and metric alerts as stateless.
Stateful alerts trigger when your alert rule condition matches your data and the same alert doesn’t exist. A stateful alert doesn’t trigger any more actions until the current alert rule conditions are clear. You can configure log alerts and metric alerts as stateful. Activity log alerts are always stateless.
Action Groups – Notifications and Define actions.
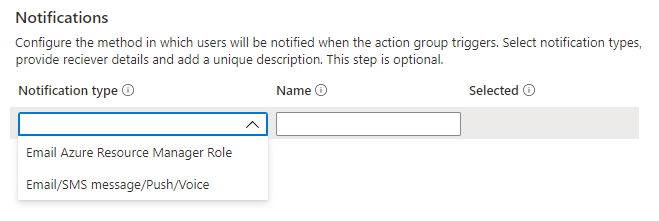
An Azure subscription owner’s action group contains notification options. Your alerts and alert rule actions activate when Azure Monitor finds an issue in your telemetry data. Azure Monitor, Azure Service Health, and Azure Advisor use action groups to inform users of alerts.
Notifications
Actions
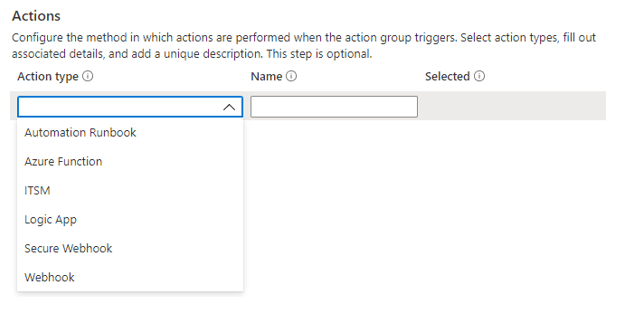
- Automation runbook design, build, orchestrate, manage, and reports on system and network operational workflows. Runbooks can connect with applications, databases, and hardware.
- Azure Functions runs event-triggered code without hardware.
- ITSM: Supported IT Service Management (ITSM) product or service. This action requires an ITSM connection.
- Logic Apps: Through the automation of your workflows, Azure Logic Apps is able to connect your mission-critical applications and services.
- Webhook are HTTPS or HTTP endpoints that allow external applications to interact with your system.
Network Watcher
Network Watcher helps administrators diagnose, monitor, and understand their network health and efficiency. Monitoring, network diagnostic tools, data, and logs comprise the components.
Network Watcher monitors, diagnoses, views metrics, and enables or disables Azure virtual network resource logs
- Automate remote network monitoring with packet capture. Network Watcher lets you fix networking issues without logging into VMs. Set alerts to collect packets for real-time performance data. Investigate an issue to improve diagnosis.
- Gain insight into your network traffic using flow logs. Network Security Group flow logs help you understand network traffic. Flow logs help you audit, watch, and comply with network security.
- Diagnose VPN connectivity issues.Network Monitor diagnoses the most common VPN Gateway and Connection issues. letting you find the problem and use the detailed logs to explore.
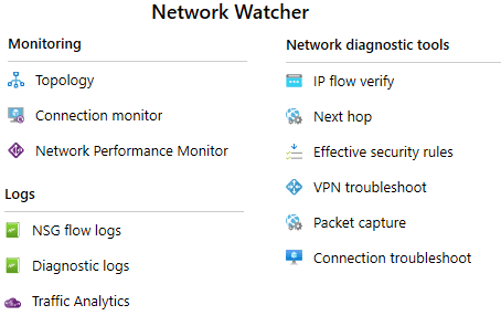
Verify IP Flow: Diagnose internet and on-premises network issues quickly. Checking if a security rule blocks virtual machine ingress or egress data. IP flow verify is ideal for security rule enforcement. If IP flow verify doesn’t show an issue when troubleshooting, check firewall restrictions.
Next Hop: To check if traffic is going to the right place by showing the next hop. This will aid check networking routing. The next hop’s path table is also returned. User-defined routes are returned. System Path otherwise. Internet, Virtual Device, Virtual Network Gateway, VNet Local, VNet Peering, or None may be your next hop. None indicates that while there may be a valid system route to the location, there is no next hop to route traffic there. When you build a virtual network, Azure creates several default outbound routes for network traffic. All outbound data from virtual network resources, such as VMs, is routed by Azure’s default routes. Azure’s preset routes can be overridden or added to.
VPN Diagnostics: Diagnose gateways and links. VPN Analyzer provides lots of data. Log files provide more data than the portal. In a storage account, log files contain connection details, CPU and memory data, IKE security errors, packet drops, buffers, and events.
NSG Flow Logs: IP traffic is tracked by NSG Flow Logs. Security auditing and compliance can use these skills. Your organization’s security governance can be based on prescriptive security norms. By comparing the prescriptive and effective rules for each VM in your network, a programmatic compliance check can be performed.
Connection Troubleshoot. Azure Network Watcher Connection Troubleshoot is a new addition to the Network Watcher set of networking tools. Azure Connection Troubleshoot lets you resolve network speed and connectivity issues.
𝐃𝐢𝐬𝐜𝐥𝐚𝐢𝐦𝐞𝐫 – All the post has only been shared for technology-related educational and knowledge-sharing purposes. Information was obtained from the source above and credited to the author or product/service company. There is no endorsement of any products or services.


